Troubleshooting
This guide walk you though the steps required to troubleshoot LibreTime.
Services status
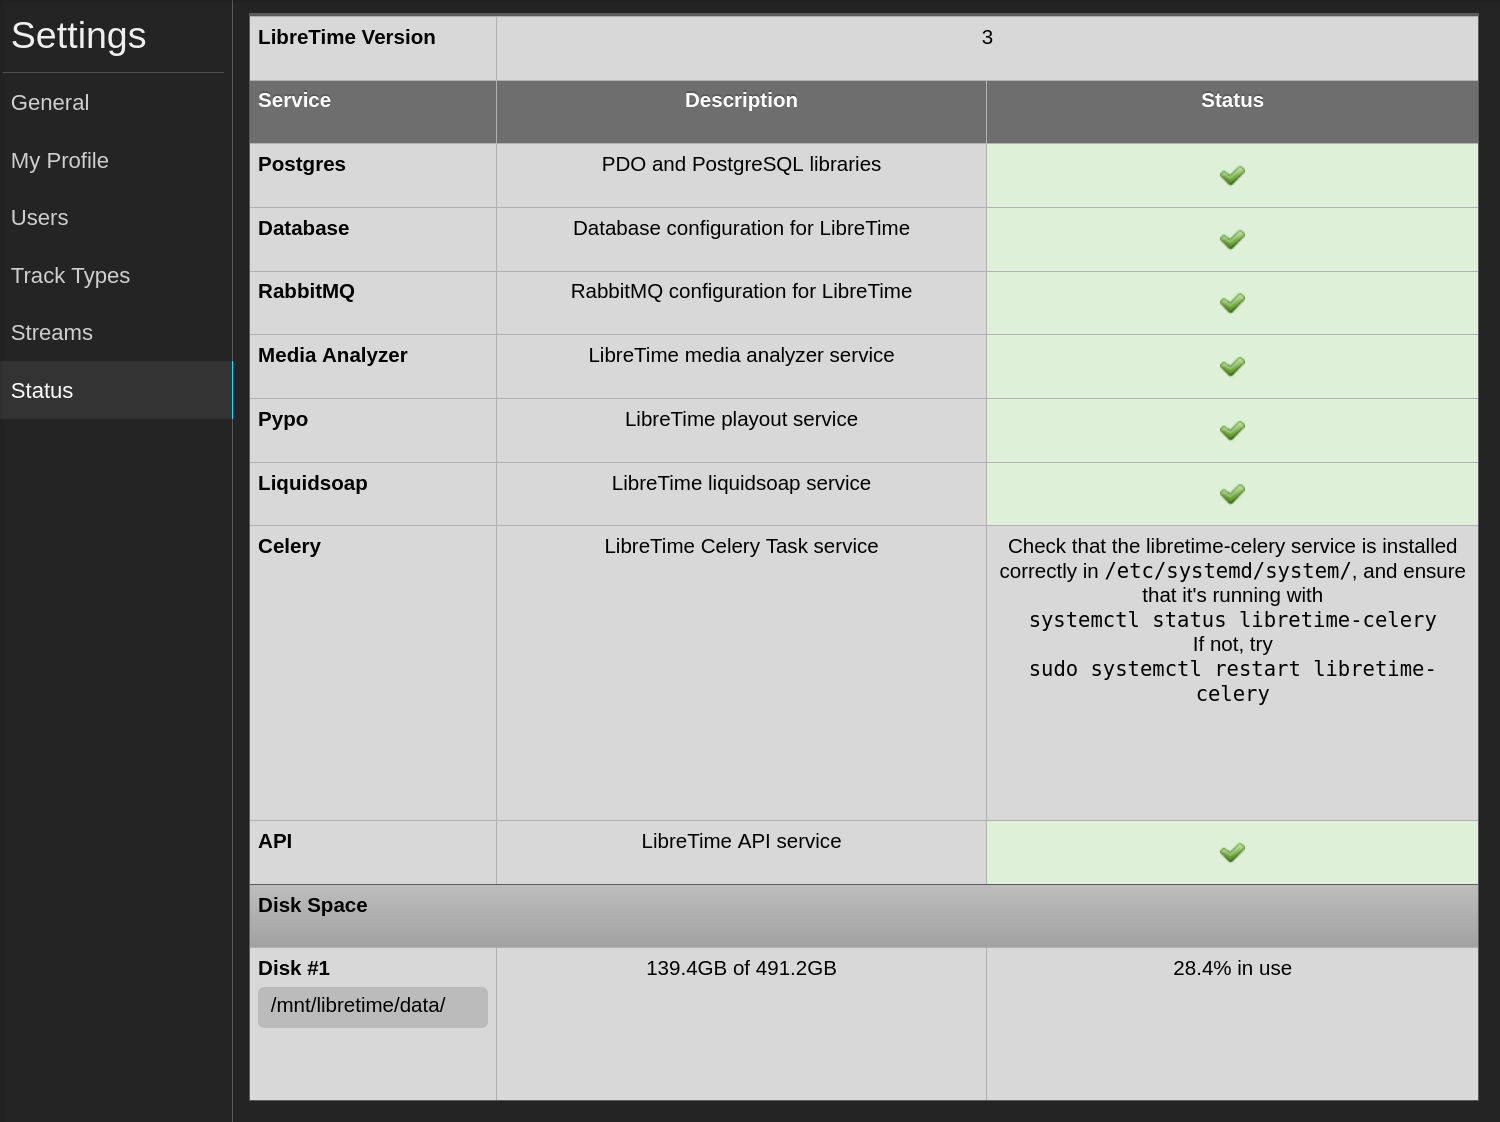
When facing a problem with LibreTime the first reflex is to verify whether the services are running.
In the web interface, go to Settings > Status to see the state of the services.

If a service isn't running, you should search for details using the tool running those services. On a common setup, you should use the systemd service status:
sudo systemctl status libretime-celery
note
Be sure to replace the service name with the problematic one.
Logs
The next place to search for details on potential errors are the log files.
The /var/log/syslog file contains most of the system logs combined. This log file may contain information that the application logger wasn't able to log, such as early startup errors. You can follow the logs using:
sudo tail -n 100 -f "/var/log/syslog"
# Filter the logs
sudo tail -n 100 -f "/var/log/syslog" | grep "libretime-"
On a common setup, to access LibreTime specific logs you should search for the following files:
- The
/var/log/libretime/analyzer.logfile contains logs from the analyzer, - The
/var/log/libretime/api.logfile contains logs from the api, - The
/var/log/libretime/legacy.logfile contains logs from the legacy app, - The
/var/log/libretime/liquidsoap.logfile contains logs from liquidsoap, - The
/var/log/libretime/playout.logfile contains logs from playout.
For some LibreTime services, you can set a higher log level using the LIBRETIME_LOG_LEVEL environment variable, or by running the service by hand and using a command line flag:
sudo -u www-data libretime-analyzer --config /etc/libretime/config.yml --log-level debug
The /var/log/apache2/libretime.error.log file contains logs from the web server.